
MPS: What Is Your Problem??

That's a serious question!
Minneapolis Public Schools confronts two simultaneous and related crises: a precipitous and ongoing decline in student enrollment, and a structural budget deficit with a narrowing range of options for handling it.
And MPS has just unveiled a set of transformative options that are... well, certainly bold.
But for the life of me, I cannot figure out how these new plans are supposed to fix either horn of the structural crisis plaguing the district.
I look at the proposed solution, and it really does make me wonder: what do they think their problem is?
Well, let's start with the proposed solution. On September 15, Minneapolis Public Schools (MPS) showed its school board three plans that would close or merge between 14 and 16 schools, starting in fall 2027. Twelve schools close in all three versions. Across the options, about 3,000 to 3,500 students, roughly one in eight, are enrolled in programs that would close or move (MPS enrollment data; Minnesota Reformer). The board plans to vote on November 10, a week after an election that fills five of its nine seats (Star Tribune).
Doesn't it sound like building consolidation will address both the things below?
- A budget squeeze right now. The district had a $39.7 million gap to close for this school year (which it covered with fund balance).
- Fewer students over the long run. MPS enrolled about 44,000 students (by the state's funding count) in 2001-02. Today it has about 30,000, in buildings designed for about 43,000 (Star Tribune).
Closing buildings always sounds like an answer to both: you've got fewer buildings to heat and staff, and you end up with a school system "right-sized" to the students it has.
But the evidence, much of it from MPS itself, says closures solve neither.
We recorded an emergency episode of Budget Committee! about this when organizers in the city asked us to – but I also wanted to show my work a little bit when it comes to evaluating the likely effects of this plan.
Problem one: the budget.
Closing buildings saves almost nothing!
Let's start with the district's own numbers. On September 25, MPS posted a cost estimate for each option for the 2027-28 school year. Here is what MPS estimates each option would save in a year:
- Option 1 (15 schools close): $721,291
- Option 2 (14 schools close): $184,345
- Option 3 (16 schools close): $2,358,565
Again, the gap MPS had to close this year was $39.7 million. The best option covers about 6 percent of that. The smallest covers less than half of one percent.
The savings are so small because buildings are not where the money goes. A school district spends most of its budget on people: teachers, aides, counselors, principals, bus drivers. In Minneapolis, staff make up about 80 percent of an operating budget of about $800 million (Star Tribune). MPS expects to save $560,000 to $705,000 a year on utilities and other building costs. Across the closing schools, that is about $40,000 per building. Busing adds about $3 million. Those are the only savings in the estimate, and most of them go to the extra staff MPS plans for the schools that stay open.
The district is candid about this. Its September 25 update says "the goal of the transformation process is not to reduce expenses." MPS plans to put any savings back into the remaining schools. That goal could be argued for... but what savings? The district is facing a structural deficit! Reducing expenditures is simply how you (struggle to) maintain funding levels at the remaining buildings.
I mean, I'm glad to know that "the goal... is not to reduce expenditures." There's zero evidence that it will!
We could look to other cities and states to show the same thing:
- Chicago closed 50 schools in 2013 and promised about $43 million a year in savings. Ten years later, a Chicago Sun-Times and WBEZ analysis estimated the real savings at about $25 million a year. Almost all of it came from employing fewer principals, assistant principals and clerks. The savings came from cutting staff, not from closing buildings.
- California. A Stanford study of every California school district from 2011 to 2019 compared districts that closed schools with similar districts that didn't. Closing schools did not shrink deficits or make districts any more likely to balance their budgets. Spending fell, but revenue fell by about the same amount, because the closing districts lost an average of 287 students.
But we don't have to look at other cities and states because we have data from...
- Minneapolis itself! Over the three years from 2008-09 to 2010-11, MPS closed 8 school buildings. Inflation-adjusted expenditures fell by $16.9 million, while enrollment dropped by 266 students, costing the district $1.5 million in base revenue and up to $4.7 million from all sources. Obviously that expenditure drop wasn't entirely savings from decommissioned buildings.
And that last part leads to the second problem: cutting expenditures doesn't solve a budget deficit if it also drives enrollment down.
Problem two: enrollment.
When you close it, they leave!
In Minnesota, as in most states, money follows the student. Each student who leaves MPS takes at least $7,705 a year in basic revenue (local + state, per state formula) with them, before including any extra aid for special education, poverty or English learners. A district closing schools or otherwise reorganizing can wind up worse off if those structural adjustments drive families away.
MPS anticipates families will leave in the wake of this decision. The district expects about 5 percent of affected students, roughly 200, to leave MPS (Star Tribune).
First of all, let's ask: Is that a reasonable assumption? The 2008-2011 closures displaced 1,431 students. When the dust had settled, there were 266 fewer students in MPS than there had been when the closures began. That enrollment drop represents 18.5% of the "affected students." Now, importantly, that's not to claim that 18.5% of those students left the district. But if the district is estimating that 200 students will leave the district as a specific result of these changes, it would be wise to add that number to the total enrollment-decline trend.
Second of all, let's just take that 5% or 200-student estimate at face value: 200 students times $7,705 is more than $1.5 million per year in lost base revenue. That alone is more than Option 1 or Option 2 would save. The district itself is estimating that adopting this plan will deepen the budgetary hole in the immediate term.
I think 200 students is wildly optimistic, and Minneapolis's own very recent history is the reason why. In 2020 the district carried out a major redesign, the Comprehensive District Design, which redrew attendance zones and moved programs between buildings. It closed no schools, so theoretically it was less disruptive than the plan currently under consideration. And in 2020, too, its planners expected the changes to drive some families away.
That redesign took effect in fall 2020, the same year COVID upended every school system in the country. MPS's enrollment plummeted, and so did everyone else's.
So how do you isolate the redesign's effect from the effect of the pandemic? You compare MPS to districts that weren't doing a comprehensive redesign.
I built Minneapolis a statistical "twin": a mix of other large Minnesota districts, mostly the St. Paul Public Schools. I matched these to MPS based on their 2015-19 enrollment trends, averaged those trends, and scaled it up (like pro-rating) to MPS's 2014-15 enrollment level. This statistical twin also went through COVID. But it did not go through the redesign.
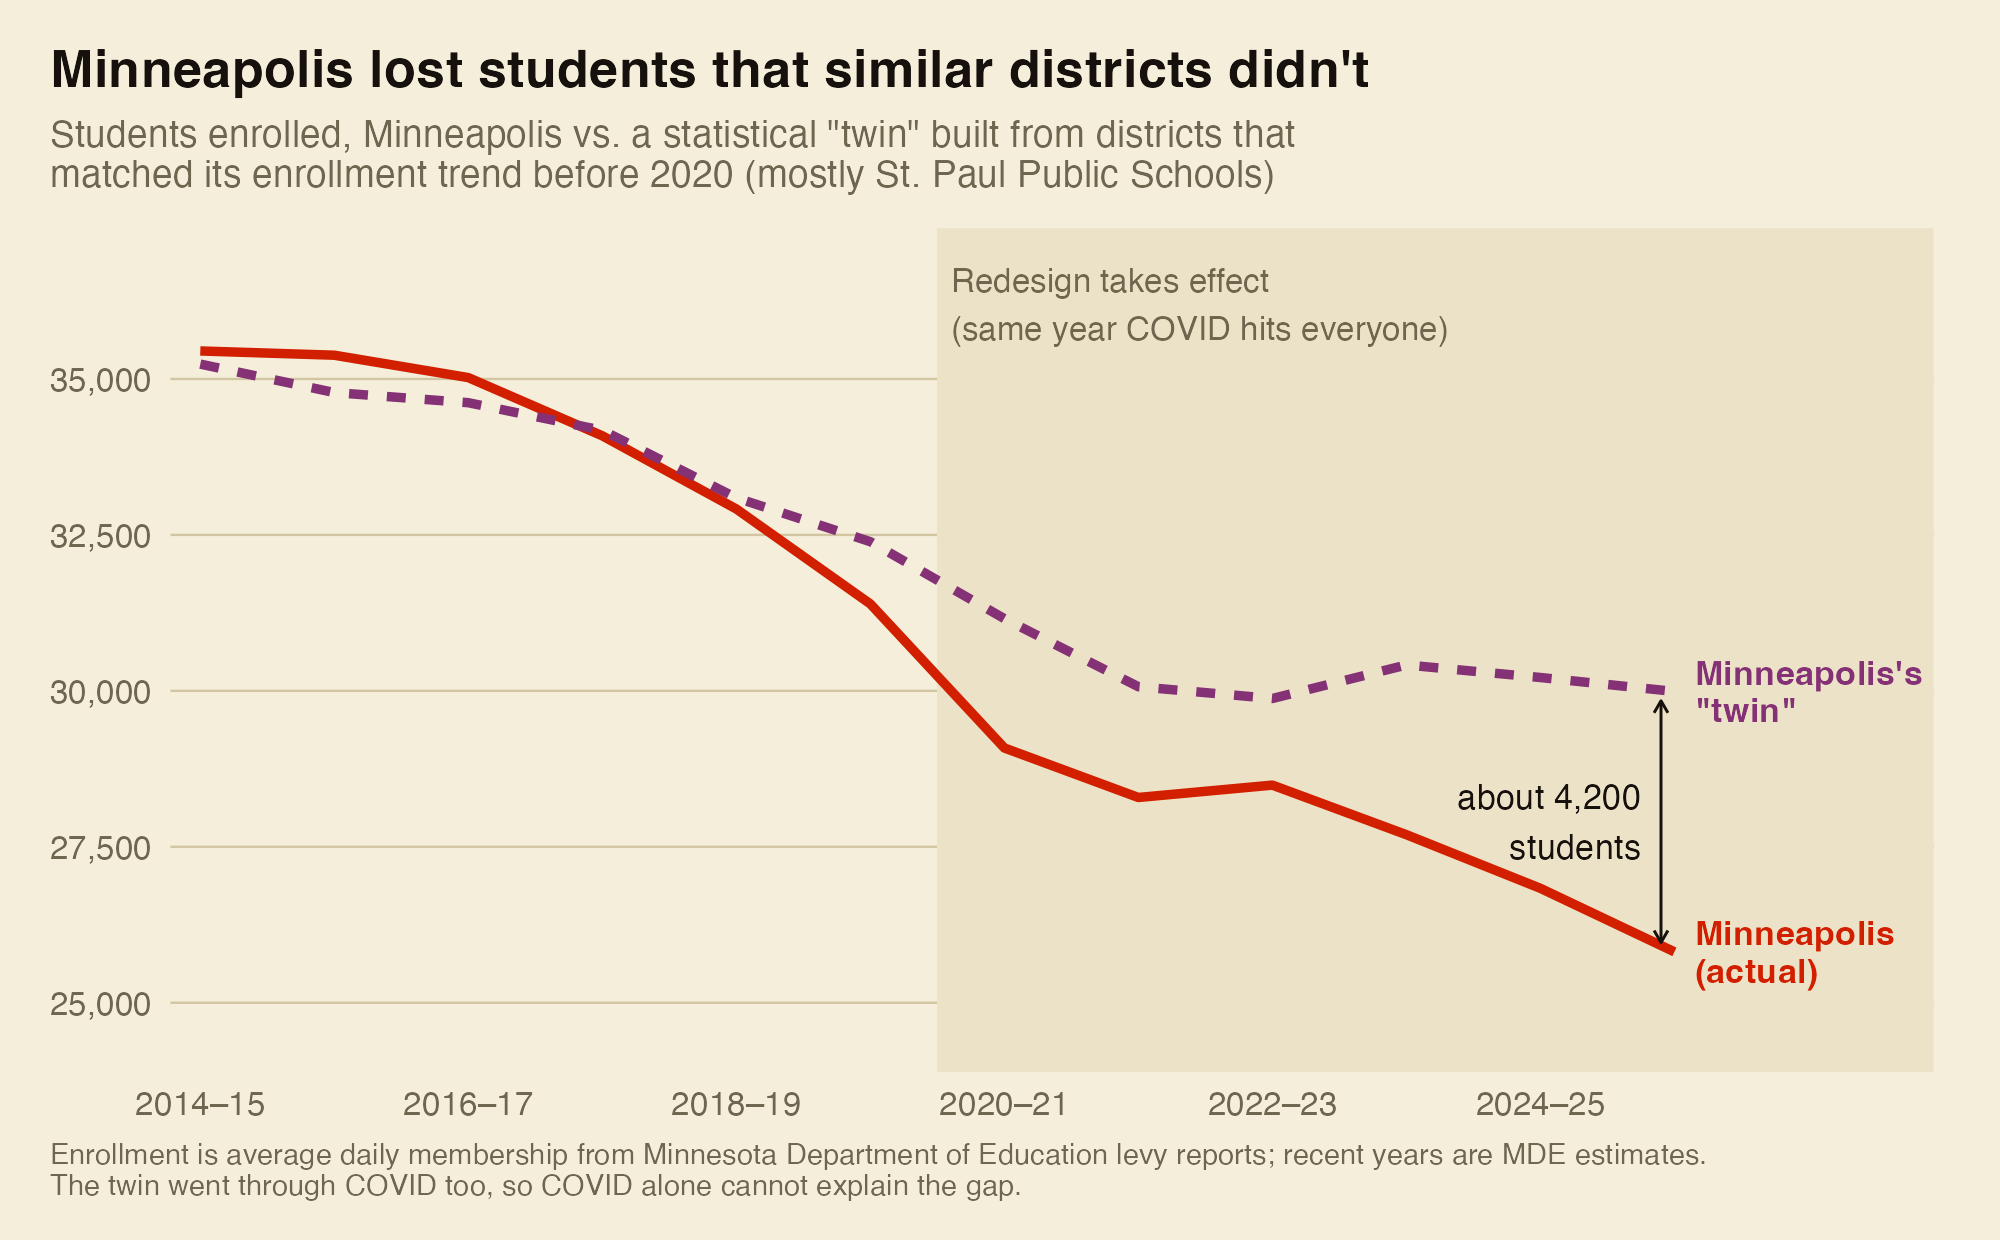
The two lines move more or less together until Minneapolis starts slipping in 2019-20, while the redesign was being fought over. In the first year of the redesign, Minneapolis fell about 2,100 students below its twin. The gap has grown every year since, to about 4,200 students.
This just means two things: (a) There is no evidence that system-wide redesigns aimed at improving educational offerings and access have a positive effect on enrollment; and (b) There is very recent homegrown evidence that such redesigns can have a negative effect on enrollment. And enrollment affects revenue!
Here's a rough (and low-end) dollar figure: 4,200 students times $7,705 in basic aid is more than $30 million a year. That is close to the size of the gap MPS had to close this year. The two are not the same thing, but the order of magnitude matters. The district's enrollment problem and its budget problem are tied together, and upheaval makes both worse – at the very least, there's zero evidence that upheaval makes either better!
So what does keep families? Confidence
If upheaval pushes families out, what keeps them coming back? I have some data that offers a answer. School Perceptions, where I'm the senior research director, surveys tons of parents and staff in Wisconsin school districts every year. (We also work with Minnesota districts, but few enough and sparsely enough that I can't draw conclusions from that data.) I matched those climate surveys to each district's enrollment two years later. Basically, I wanted to know: Does staff and/or parent perception of a school district predict enrollment changes?
Now, of course, good survey results might just be a sign of things already going well. A district that is already growing, maybe because new housing is filling up, will have happier parents and more students, and I so wanted to make sure I'm controlling for prior enrollment trends. Also, a district that starts spending more might have happier parents and more students too, and then the credit might belong to the money. So I checked for both, one step at a time. I compared each district with itself, and then only with districts that:
- Started with the same enrollment in the year of the survey.
- Had the same enrollment trend of their own over the two years before the survey: growing, shrinking or flat.
- Had the same spending trend of their own over those same two years, measured as the district's total spending after inflation (not per student), so districts that had been spending more or cutting back are compared with others that did the same.
You'll see in the table, as the open circle moves to the red one, the effect of those controls. But you'll also see that even with those controls better climate ratings are associated with enrollment growth.
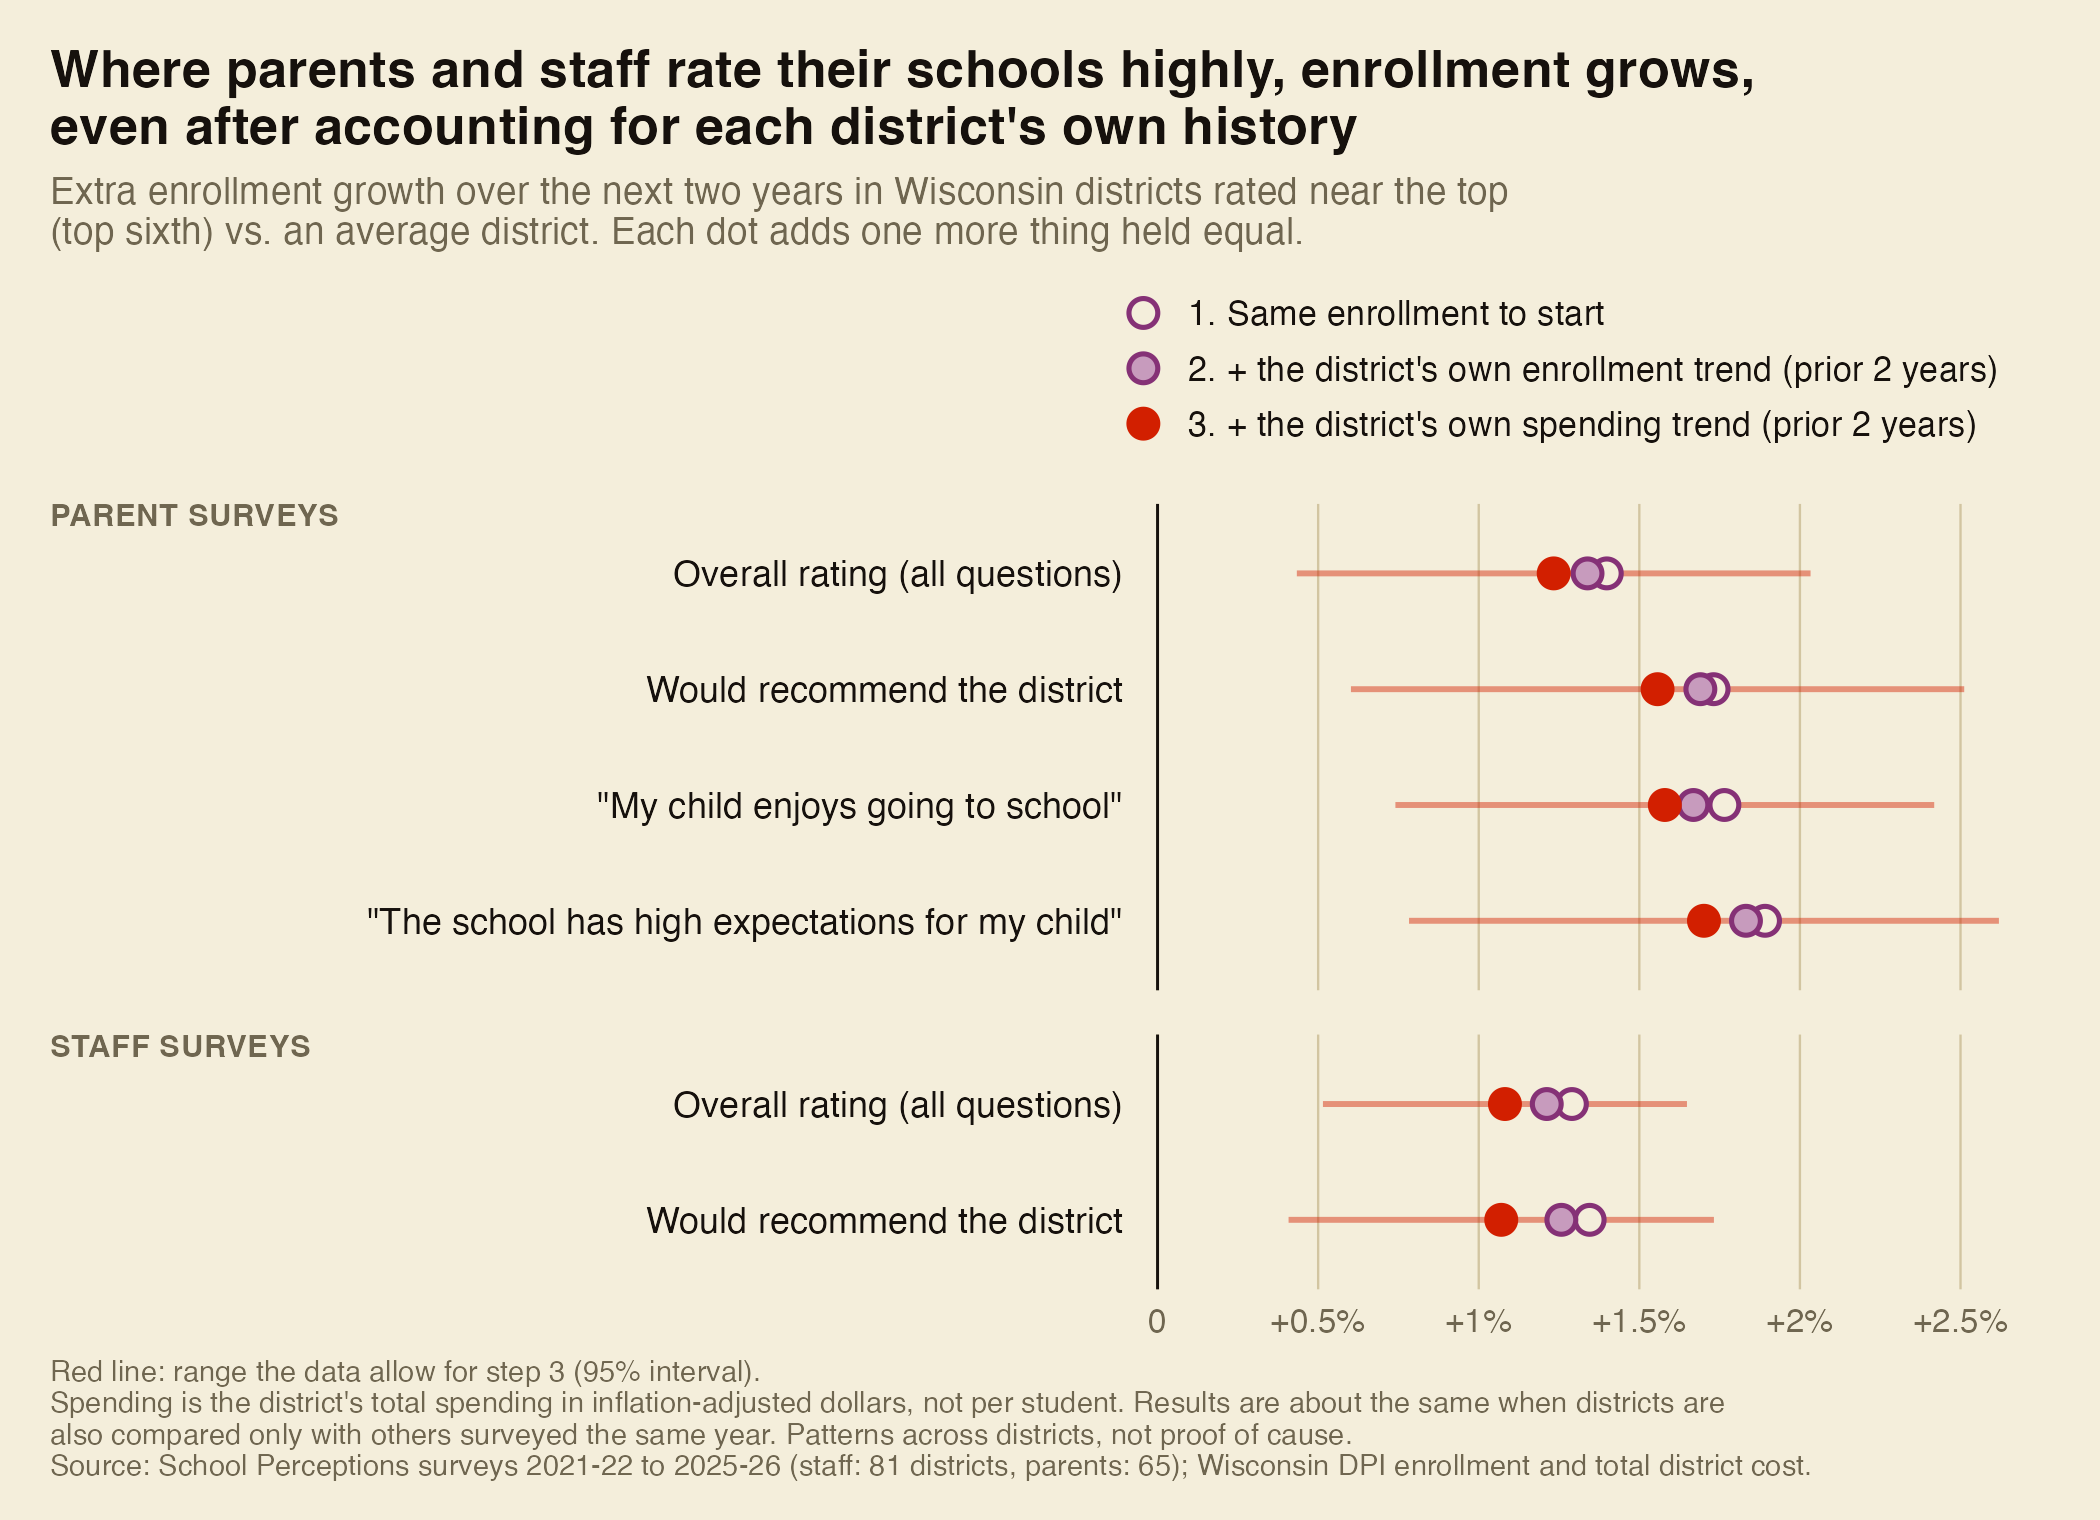
Each row of the chart shows one survey measure, with a dot for each step. Accounting for each district's own enrollment trend and its own spending trend shrinks the link slightly. The red lines show the range the data allow at the final step, and every one stays above zero.
Basically: where parents gave their schools high overall ratings, enrollment grew about 1.2 percent more over two years than in an average district, after all three comparisons. Staff ratings show about 1.1 percent. The single strongest parent measures are whether "the school has high expectations for my child" (1.7 percent) and whether "my child enjoys going to school" (1.6 percent).
A 1.2 percent edge sounds small. For a district the size of Minneapolis, it's about 300 to 350 students, or roughly $2.3 million to $2.6 million a year in base revenue alone. That's about what the most aggressive closure option would save, and improving staff and parent climate gets you there without closing anything.
I also turned to survey data to see what happens to school climate where closures land. If we know staff and parent perceptions of schools are associated with enrollment growth, then what happens to those perceptions when you close schools?
Here I'm going to emphasize that this evidence is suggestive. My school climate dataset only goes back to 2020-2021 (at the moment), and it's all Wisconsin data. That really limits the number of districts and closures where I have climate data on both sides of the "closure event." In fact, I don't even have enough parent data to speak provisionally about that group (though parent and staff opinion tend to move together on overall district measures like "would you recommend this district.")
There are six Wisconsin districts that (a) closed at least one school and (b) surveyed staff both before and after. In each district, I compared the school buildings that remained–the ones that took in the closed school's students--against the other buildings in the district. After all six closures with enough data to compare, staff in the receiving buildings grew a little less positive about their school than staff elsewhere in the district. The drops were mostly small, though a couple districts did see larger changes. Across all 17 receiving buildings, the average dip is too small to rule out chance, but there's also no evidence that climate gets better in the wake of building consolidation. It is a hint that the buildings asked to absorb a closure lose some of the confidence that the chart above ties to enrollment growth.
Two cautions. These are patterns across Wisconsin districts. It's not a controlled experiment, and it's not Minnesota data. Still, the direction matches everything above. Families stay where they trust the school and expect it to be there. Closures, especially rushed ones, use up that trust.
What would help?
If closures don't fix the budget or the enrollment slide, it's fair to ask what would. Some of what is squeezing MPS has nothing to do with buildings:
- The district's finance office has made costly mistakes. Its top three finance leaders left in January. Since then, reporting has uncovered a $4.1 million special-education reimbursement MPS lost because expenses went unreported, more than $5 million in federal tax-form penalties, and an earlier special-education coding error that cost the district money for years. Fixing the finance office is cheaper than closing schools, and it doesn't make any families leave.
- The state doesn't fully cover special education. Federal law requires the services. Minnesota reimburses only part of the cost, so districts pay the rest out of their general budget. For MPS the difference was about $43 million in 2023-24, according to state figures, about twice the statewide rate per student. Any fix for that has to come from the Legislature, not from closing buildings. If Minnesota reimbursed districts for 100% of special education expenditures (Wyoming is the only state that goes that high), it would cost the state government roughly half a billion dollars a year. So, relatively low feasibility.
- Minnesota's declining enrollment aid is inadequate. Minnesota basically has a 20% hold-harmless provision, which just means that for every 100 students who leave year-over-year, the district gets to pretend (for revenue purposes) that only 80 have left. But there are other, better models! Michigan's hold-harmless is more aggressive. Wisconsin funds districts on a rolling three-year average of enrollment, so a district losing students has time to adjust. Minnesota doesn't have that kind of cushion, but it could! That's a state-level policy tweak.
- The local tax base has grown fast. Minneapolis property values have soared while enrollment fell. The city's taxable property per public school student roughly doubled between 2015 and 2023, to about $2.3 million per student (Minnesota Department of Education levy reports). The community has the wealth to invest in its schools, if it decides to. And the community keeps passing referendums by huge margins – the will is there! However, state policy limits the amount of revenue that can be raised through that mechanism. Another thing for the state to look at.
Organizing can change the choices on the table. In 2024, Seattle Public Schools faced a gap of nearly $100 million and proposed closing up to 21 schools. After months of pushback from families, the district dropped the plan and turned to the state for help. The following spring, Washington's Legislature voted to remove its cap on special-education funding, adding $750 million over four years statewide.
When I am setting out policy recommendations in cases like these, I'm always using two criteria:
1.) Will this allow coalition-building? If a policy change is just a one-district bailout, you'll never get state-level support. In Minnesota, however, increasing special ed reimbursement, changing the declining-enrollment formula, and so on, would be a huge boon to small rural districts, as well.
2.) Is there a model for this kind of policy in other states? It's important to be able to show that a policy recommendation is already at work somewhere else, that it's not just pie-in-the-sky or made up out of whole cloth. Wyoming reimburses its schools fully for special ed expenditures. Massachusetts has more generous special-ed "circuit breakers" to alleviate those budgetary pressures. Other states have a variety of ways of smoothing year-over-year enrollment volatility so that districts don't lose (or gain) revenue in destabilizing ways.
So what's the takeaway?
Closing schools is permanent. Once a building is sold or repurposed and its families have scattered to charters, suburbs and private schools, they do not come back when the budget improves – not that that is what the district is promising to do.
The district's estimates shows these closures would save between $184,000 and $2.4 million a year. Minneapolis's own history shows that shaking up schools drives families away, and every family that leaves takes revenue with it. The Wisconsin data suggest that the thing most closely tied to enrollment growth is whether parents and staff trust their schools.
The transformation plan seems to come with (potentially) really high costs, (estimated) scant savings, and a really aspirational enrollment strategy (to put it charitably) that rests on the assumption that families choose districts because of the consistency of the educational experience on offer.
MPS is taking feedback through October 16 in an online survey and at community meetings from September 30 to October 9. The board is scheduled to vote November 10.